Fund
/Ticker
Fidelity® Blue Chip Growth K6 Fund
/FBCGX
Summary Prospectus
September 29, 2023
Before you invest, you may want to review the fund's prospectus, which contains more information about the fund and its risks. You can find the fund's prospectus, reports to shareholders, and other information about the fund (including the fund's SAI) online at www.fidelity.com/workplacedocuments. You can also get this information at no cost by calling 1-800-835-5095 or by sending an e-mail request to fidfunddocuments@fidelity.com. The fund's prospectus and SAI dated September 29, 2023 are incorporated herein by reference.
245 Summer Street, Boston, MA 02210
Fund Summary
Fund:
Fidelity® Blue Chip Growth K6 Fund
Investment Objective
Fidelity® Blue Chip Growth K6 Fund seeks growth of capital over the long term.
Fee Table
The following table describes the fees and expenses that may be incurred when you buy, hold, and sell shares of the fund.
In addition to the fees and expenses described below, your broker may also require you to pay brokerage commissions on purchases and sales of the fund.
Shareholder fees
|
(fees paid directly from your investment)
|
None
|
Annual Operating Expenses
(expenses that you pay each year as a % of the value of your investment)
|
Management fee
|
0.45
%
|
|
Distribution and/or Service (12b-1) fees
|
None
|
|
Other expenses
|
0.01
%
|
|
Total annual operating expenses
|
0.46
%
A
|
A
Differs from the ratios of expenses to average net assets in the Financial Highlights section of the prospectus because of acquired fund fees and expenses. For the period, acquired fund fees and expenses are less than 0.01% and are included in other expenses.
This
example
helps compare the cost of investing in the fund with the cost of investing in other funds.
Let's say, hypothetically, that the annual return for shares of the fund is 5% and that the fees and the annual operating expenses for shares of the fund are exactly as described in the fee table. This example illustrates the effect of fees and expenses, but is not meant to suggest actual or expected fees and expenses or returns, all of which may vary. For every $10,000 you invested, here's how much you would pay in total expenses if you sell all of your shares at the end of each time period indicated:
Let's say, hypothetically, that the annual return for shares of the fund is 5% and that the fees and the annual operating expenses for shares of the fund are exactly as described in the fee table. This example illustrates the effect of fees and expenses, but is not meant to suggest actual or expected fees and expenses or returns, all of which may vary. For every $10,000 you invested, here's how much you would pay in total expenses if you sell all of your shares at the end of each time period indicated:
|
1 year
|
$
|
47
|
|
3 years
|
$
|
148
|
|
5 years
|
$
|
258
|
|
10 years
|
$
|
579
|
Portfolio Turnover
The fund pays transaction costs, such as commissions, when it buys and sells securities (or "turns over" its portfolio). A higher portfolio turnover rate may indicate higher transaction costs and may result in higher taxes when fund shares are held in a taxable account. These costs, which are not reflected in annual operating expenses or in the example, affect the fund's performance. During the most recent fiscal year, the fund's portfolio turnover rate was
24
% of the average value of its portfolio.
Principal Investment Strategies
- Normally investing primarily in common stocks.
- Normally investing at least 80% of assets in blue chip companies (companies that, in Fidelity Management & Research Company LLC (FMR)'s view, are well-known, well-established and well-capitalized), which generally have large or medium market capitalizations.
- Investing in companies that FMR believes have above-average growth potential (stocks of these companies are often called "growth" stocks).
- Investing in domestic and foreign issuers.
- Using fundamental analysis of factors such as each issuer's financial condition and industry position, as well as market and economic conditions, to select investments.
Principal Investment Risks
- Stock Market Volatility.
Stock markets are volatile and can decline significantly in response to adverse issuer, political, regulatory, market, or economic developments. Different parts of the market, including different market sectors, and different types of securities can react differently to these developments.
- Foreign Exposure.
Foreign markets can be more volatile than the U.S. market due to increased risks of adverse issuer, political, regulatory, market, or economic developments and can perform differently from the U.S. market.
- Issuer-Specific Changes.
The value of an individual security or particular type of security can be more volatile than, and can perform differently from, the market as a whole.
- "Growth" Investing.
"Growth" stocks can perform differently from the market as a whole and other types of stocks and can be more volatile than other types of stocks.
- Mid Cap Investing.
The value of securities of medium size, less well-known issuers can perform differently from the market as a whole and other types of stocks and can be more volatile than that of larger issuers.
An investment in the fund is not a deposit of a bank and is not insured or guaranteed by the Federal Deposit Insurance Corporation or any other government agency
.
You could lose money by investing in the fund.
Performance
The following information is intended to help you understand the risks of investing in the fund.
The information illustrates the changes in the performance of the fund's shares from year to year and compares the performance of the fund's shares to the performance of a securities market index over various periods of time.
The index description appears in the "Additional Index Information" section of the prospectus.
Past performance is not an indication of future performance.
Visit
www.401k.com
and log in for more recent performance information.
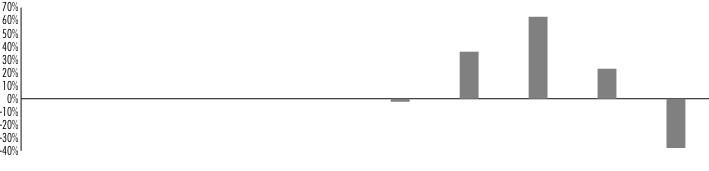
Year-by-Year Returns
|
2018
|
2019
|
2020
|
2021
|
2022
|
||||||
|
-
2.32
%
|
36.11
%
|
62.94
%
|
23.05
%
|
-
37.84
%
|
 |
|
During the periods shown in the chart:
|
Returns
|
Quarter ended
|
|
Highest Quarter Return
|
37.32
%
|
June 30, 2020
|
|
Lowest Quarter Return
|
-
27.26
%
|
June 30, 2022
|
|
Year-to-Date Return
|
39.02
%
|
June 30, 2023
|
Average Annual Returns
|
For the periods ended December 31, 2022
|
Past 1
year
|
Past 5
years
|
Life of fund A |
|
Fidelity® Blue Chip Growth K6 Fund
|
-
37.84
%
|
10.63
%
|
12.04
%
|
|
Russell 1000® Growth Index
(reflects no deduction for fees, expenses, or taxes)
|
-
29.14
%
|
10.96
%
|
12.33
%
|
A
From
May 25, 2017
.
Investment Adviser
FMR (the Adviser) is the fund's manager. Other investment advisers serve as sub-advisers for the fund.
Portfolio Manager(s)
Sonu Kalra (Portfolio Manager) has managed the fund since 2017.
Purchase and Sale of Shares
Shares generally are available only to certain employer-sponsored retirement plans. For this purpose, employer-sponsored retirement plans generally include profit sharing, 401(k), 403(b), 457(b), defined benefit, retiree health savings plans, and similar plans, but generally do not include: retail retirement or non-retirement accounts; Individual Retirement Accounts (IRAs) (such as traditional, Roth, SEP, SARSEP, and SIMPLE IRAs); Coverdell Education Savings Accounts; individual 403(b) accounts that are not part of an employer's 403(b) plan; plans investing through the Fidelity Advisor
®
403(b) program; plans covering self-employed individuals and their employees (formerly Keogh/H.R. 10 plans); health savings accounts; or qualified tuition programs. Plan participants may purchase shares only if shares are eligible for sale and available through their plan.
You may buy or sell shares in various ways:
Internet
www.401k.com
Phone
For Individual Accounts (investing through a retirement plan sponsor or other institution), refer to your plan materials or contact that institution directly.
For Retirement Plan Level Accounts:
Corporate Clients 1-800-962-1375
"Not for Profit" Clients 1-800-343-0860
Mail
|
Redemptions:
Fidelity Investments
P.O. Box 770001
Cincinnati, OH 45277-0035
|
Overnight Express:
Fidelity Investments
100 Crosby Parkway
Covington, KY 41015
|
TDD -
Service for the Deaf and Hearing Impaired
1-800-544-0118
The price to buy one share is its net asset value per share (NAV). Shares will be bought at the NAV next calculated after an order is received in proper form.
The price to sell one share is its NAV. Shares will be sold at the NAV next calculated after an order is received in proper form.
The fund is open for business each day the New York Stock Exchange (NYSE) is open.
There is no purchase minimum for fund shares.
Tax Information
Distributions by the fund to tax-advantaged retirement plan accounts are not taxable currently (but you may be taxed later, upon withdrawal of your investment from such account).
Payments to Broker-Dealers and Other Financial Intermediaries
The fund, the Adviser, Fidelity Distributors Company LLC (FDC), and/or their affiliates may pay intermediaries, which may include banks, broker-dealers, retirement plan sponsors, administrators, or service-providers (who may be affiliated with the Adviser or FDC), for the sale of fund shares and related services. These payments may create a conflict of interest by influencing your intermediary and your investment professional to recommend the fund over another investment. Currently, the Board of Trustees of the fund has not authorized such payments for shares of the fund. Ask your investment professional or visit your intermediary's web site for more information.
Fidelity Distributors Company LLC (FDC) is a member of the Securities Investor Protection Corporation (SIPC). You may obtain information about SIPC, including the SIPC brochure, by visiting www.sipc.org or calling SIPC at 202-371-8300.
Fidelity, the Fidelity Investments Logo and all other Fidelity trademarks or service marks used herein are trademarks or service marks of FMR LLC. Any third-party marks that are used herein are trademarks or service marks of their respective owners. © 2023 FMR LLC. All rights reserved.
|
1.9881214.108
|
BCFK6-SUM-0923
|